# 6. Matplotlib, Pyecharts 绘图
# 1. 安装
本篇主要是 Python 绘图方法的笔记,以 matplotlib 为主,还包含 seaborn,pyecharts 等模块
安装 Matplotlib🔗 (opens new window)
pip install matplotlib1安装 seaborn🔗 (opens new window)
pip install seabron1安装 Pyecharts, Pyecharts 绘图会保存成 HTML 文件,需要用浏览器打开
pip install pyecharts1
# 2. 绘图种类
# 2.1. plot 折线绘图
代码
import matplotlib.pyplot as plt

plt.figure()
# 两条曲线 (x1,x2) 和 (x2, y2)
plt.plot(x1, y1, x2, y2)
plt.show()
1
2
3
4
5
6plot 设置,更多设置参考 官方文档🔗 (opens new window)
plt.plot([1, 2, 3], [1, 1, 1], 'b-', label='line 1', linewidth=2)  # 蓝色直线
plt.plot([1, 2, 3], [2, 2, 2], 'g--', label='line 2', linewidth=2)  # 绿色虚线
plt.plot([1, 2, 3], [3, 3, 3], 'ro-.', label='line 3', linewidth=2)  # 红色带圈点划线
plt.plot([1, 2, 3], [4, 4, 4], 'cv:', label='line 4', linewidth=2)  # 蓝绿色倒三角点线
plt.plot([1, 2, 3], [5, 5, 5], 'm^', label='line 5', linewidth=2)  # 紫红色正三角
plt.plot([1, 2, 3], [6, 6, 6], 'y<', label='line 5', linewidth=2)  # 黄色左三角
plt.plot([1, 2, 3], [7, 7, 7], 'k>', label='line 5', linewidth=2)  # 黑色右三角
1
2
3
4
5
6
7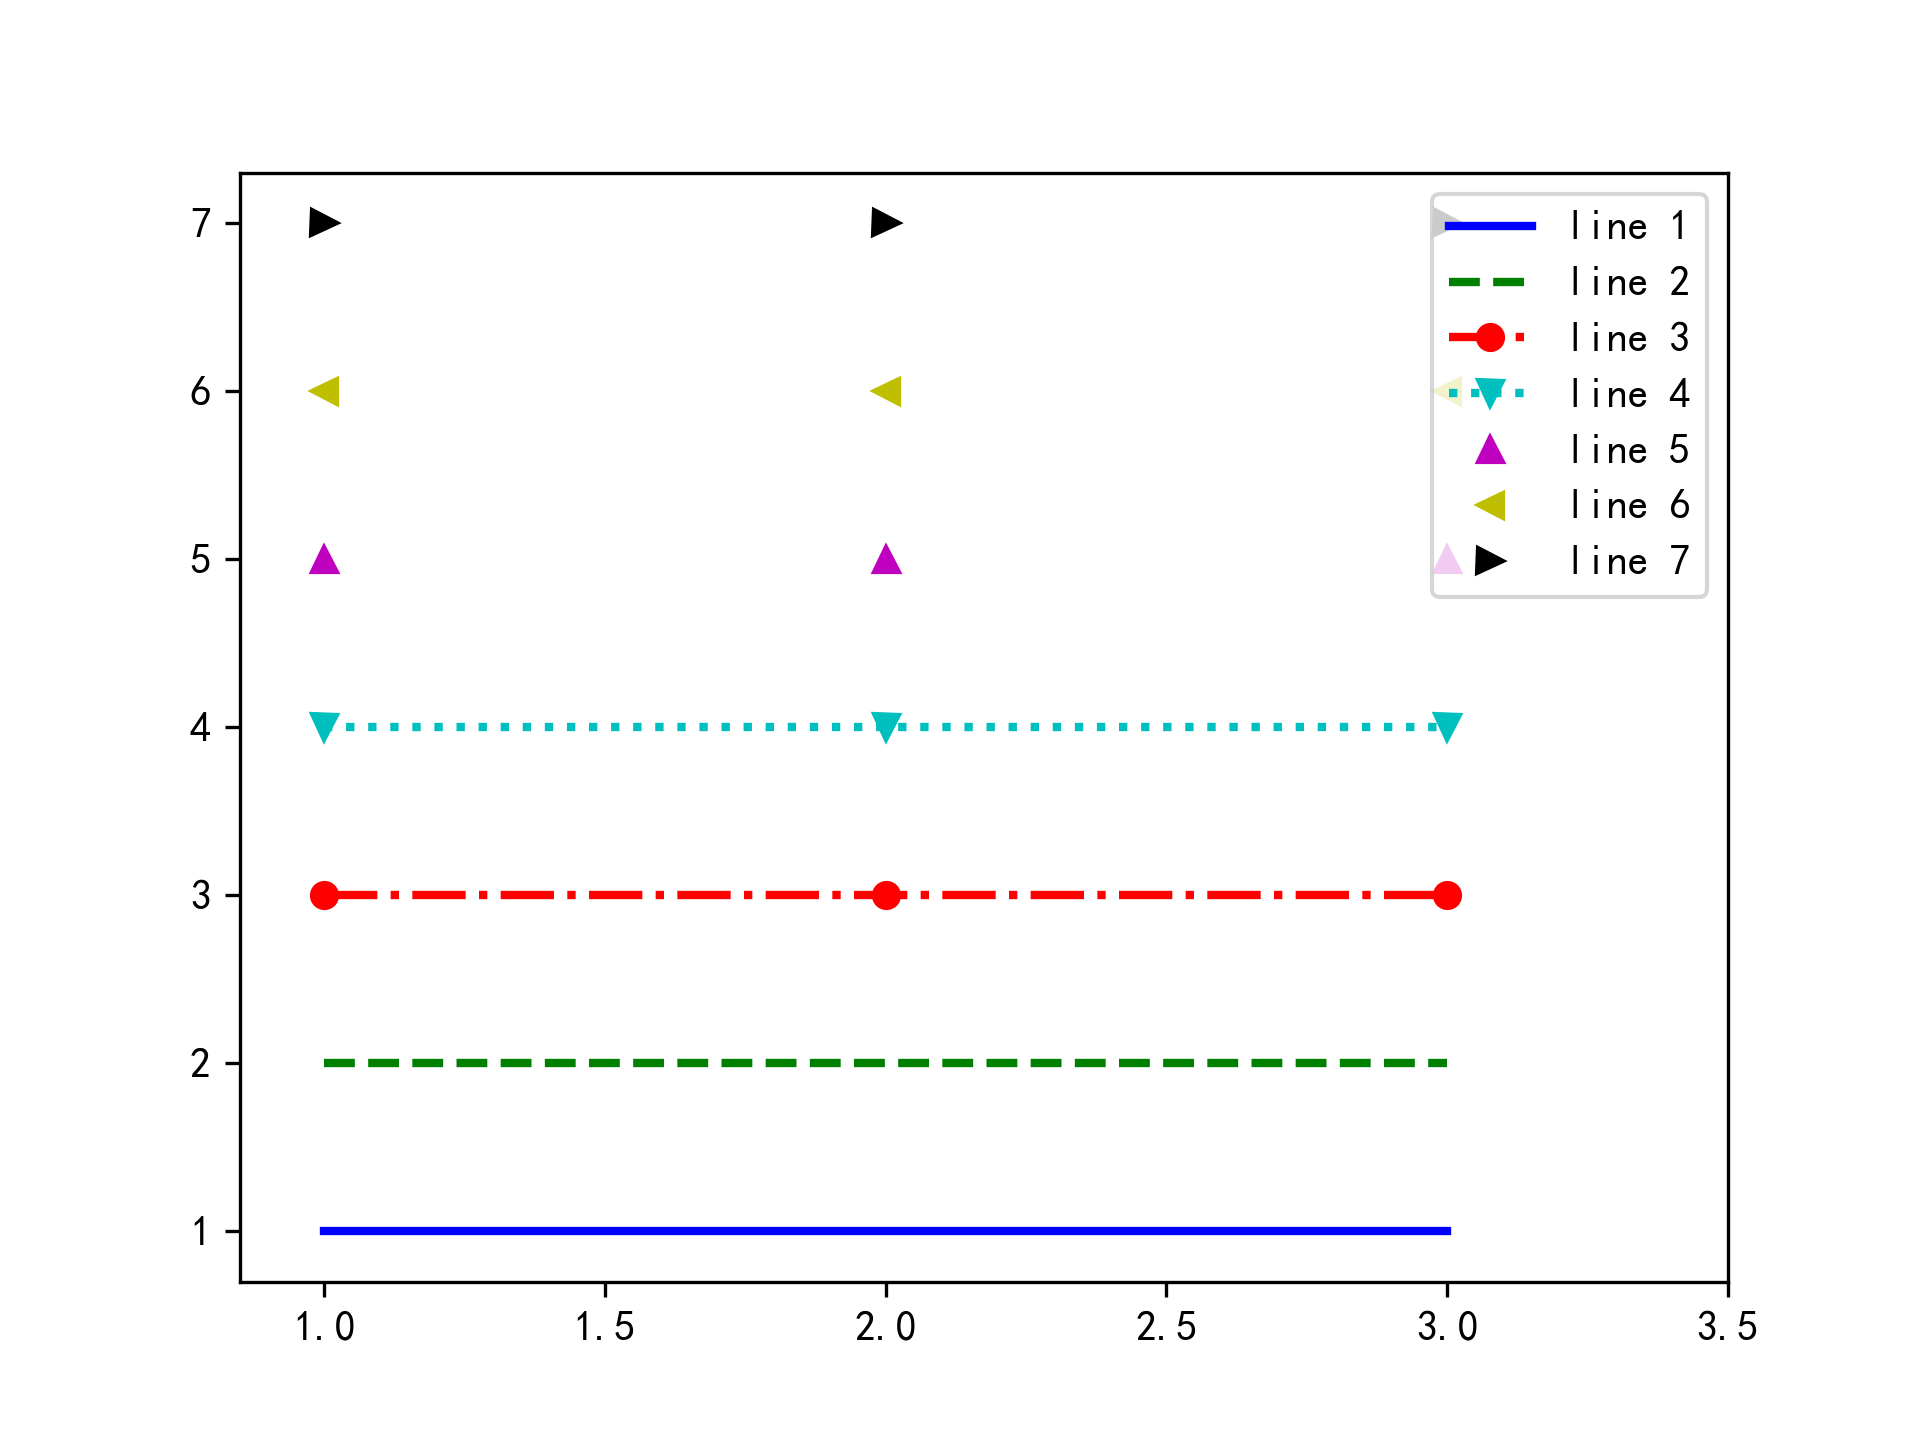
# 2.2. scatter 散点图
带颜色区分的散点图
三维散点图
fig = plt.figure()

ax = fig.add_subplot(projection='3d')
ax.scatter(x, y, z)
ax.set_xlabel('x')
ax.set_ylabel('y')
ax.set_zlabel('z')

plt.show()
1
2
3
4
5
6
7
8
9
# 2.3. bar 柱状图
基础柱状图
import matplotlib.pyplot as plt

x = list('abcd')
y = [1, 2, 3, 4]

plt.figure()
plt.bar(x, y)
plt.show()
1
2
3
4
5
6
7
8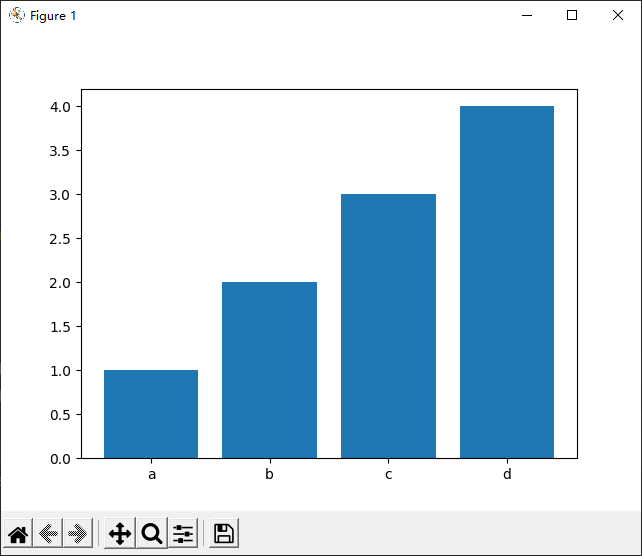
分组柱状图
import matplotlib.pyplot as plt
import numpy as np

fig, ax = plt.subplots()
width = 0.1
x = np.arange(0, 3)
y1 = [1, 2, 3]
y2 = [3, 2, 1]

# 用偏移量设置多组柱状图
b1 = ax.bar(np.add(x, -width / 2), y1, width, label='1')
b2 = ax.bar(np.add(x, width / 2), y2, width, label='2')

ax.legend() # 显示图例

ax.bar_label(b1, padding=3) # 柱状图显示数值
ax.bar_label(b2, padding=3) # 柱状图显示数值
fig.tight_layout()  # 减小图片边框

# x 轴间隔设置为 1
x_locator = plt.MultipleLocator(1)
ax.xaxis.set_major_locator(x_locator)

plt.show()
1
2
3
4
5
6
7
8
9
10
11
12
13
14
15
16
17
18
19
20
21
22
23
24堆叠柱状图
import numpy as np
from matplotlib import pyplot as plt

x = [1, 2, 3]
y1 = [1, 2, 3]
y2 = [3, 2, 1]

fig, ax = plt.subplots()
ax.bar(x, y1, label='a')
ax.bar(x, y2, bottom=y1, label='b')
ax.legend()
plt.show()
1
2
3
4
5
6
7
8
9
10
11
12参数
bar(x, height, width=0.8, bottom=None, ***, align='center', data=None, **kwargs)1参数 功能 x x 坐标 height 高度,即 y 值 width 柱宽,取值在 0-1 之间,默认 0.8 bottom 柱状图的起始位置 align 柱状图的中心位置,'edge'左边缘,'center'中心 动态柱宽
有时需要根据数据设置柱状图列宽和偏移量,下面给出推荐设置
def plot(x, y):
    # 要求是等间距 x 坐标
    delta = x[1] - x[0]

    # 图像向右偏移半个坐标(柱状图位于两个坐标正中)
    # 动态柱宽 0.9 * delta 比较好看,可以根据需求适当调整
    plt.bar(np.array(x) + 0.5 * delta, y, width=0.9 * delta)
1
2
3
4
5
6
7
# 2.4. pie 饼图
代码
import matplotlib.pyplot as plt

labels = 'a', 'b', 'c', 'd'
sizes = [15, 30, 45, 10]
explode = (0, 0.1, 0, 0)

plt.subplots()
# explode: 每个楔子偏离的距离
# autopct: 自动显示饼图百分比
plt.pie(sizes, explode=explode, labels=labels, autopct='%1.1f%%', shadow=True, startangle=90)
plt.axis('equal')  # Equal aspect ratio ensures that pie is drawn as a circle.

plt.show()
1
2
3
4
5
6
7
8
9
10
11
12
13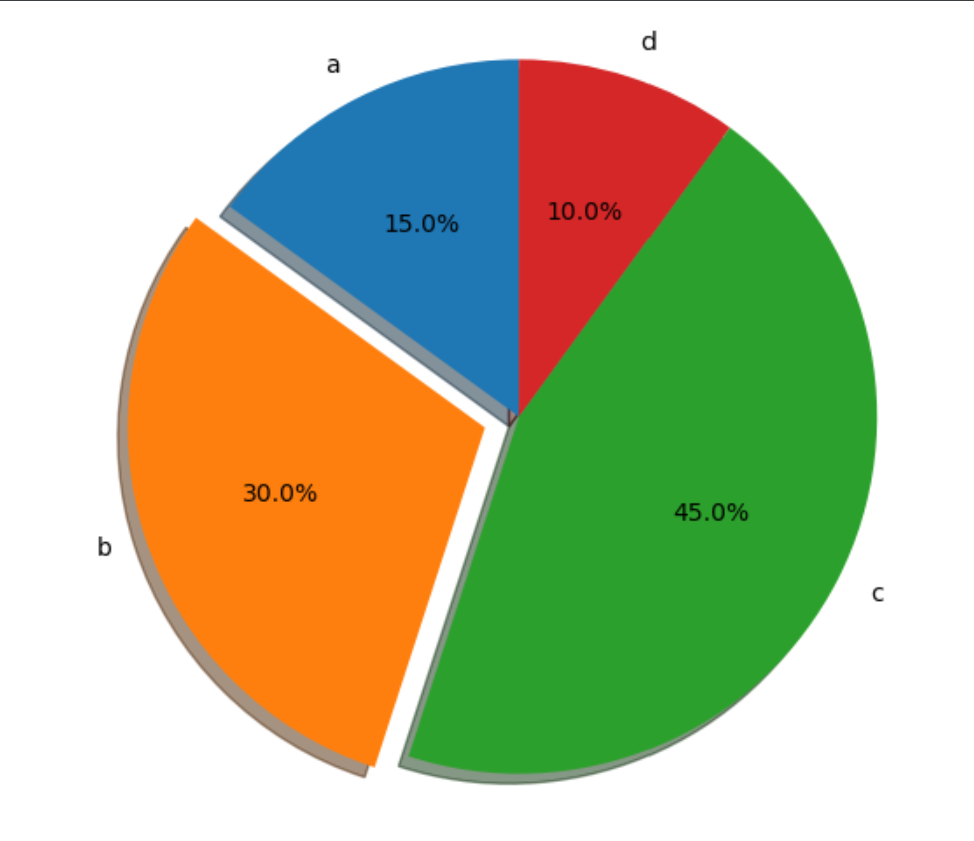
# 2.5. stackplot 堆叠面积图
堆叠面积曲线
x = [1, 2, 3]
stacks = {
    'A': [1, 2, 3],
    'B': [2, 2, 1],
    'C': [2, 1, 2]
}

fig, ax = plt.subplots()
ax.stackplot(x, stacks.values(), labels=stacks.keys())
ax.legend()
plt.show()
1
2
3
4
5
6
7
8
9
10
11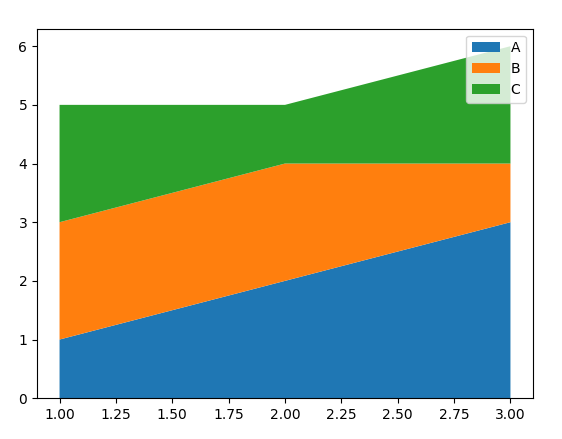
# 2.6. 盒须图/箱形图
violinplot 提琴图
import matplotlib.pyplot as plt
import numpy as np

# Random test data
np.random.seed(19680801)
all_data = [np.random.normal(0, std, size=100) for std in range(1, 4)]  # [100]*3 数组
labels = ['x1', 'x2', 'x3']

# 均值和中位数只能二选一,False 可以不设置
plt.violinplot(all_data,
               showmeans=True,  # 显示均值
               showmedians=False)  # 不显示中位数
plt.xticks([x + 1 for x in range(len(all_data))], labels=labels)
plt.show()
1
2
3
4
5
6
7
8
9
10
11
12
13
14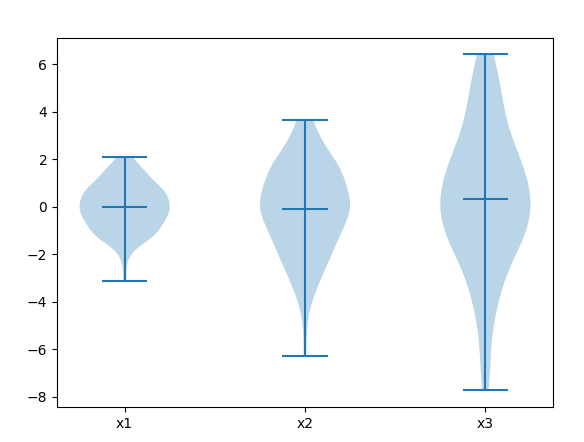
盒须图
import matplotlib.pyplot as plt
import numpy as np

# Random test data
np.random.seed(19680801)
all_data = [np.random.normal(0, std, size=100) for std in range(1, 4)]
labels = ['x1', 'x2', 'x3']

plt.boxplot(all_data)
plt.xticks([x + 1 for x in range(len(all_data))], labels=labels)
plt.show()
1
2
3
4
5
6
7
8
9
10
11
# 2.7. heatmap 热力图
代码
# 热力图
fig, ax = plt.subplots()
im = ax.imshow(df)
ax.set_xticks(np.arange(len(df.columns)), labels=df.columns)  # 坐标显示成文字
ax.set_yticks(np.arange(len(df.index)), labels=df.index)  # 坐标显示成文字

# 热力图中显示数值
for i in range(len(df.index)):
    for j in range(len(df.columns)):
        ax.text(j, i, df.iloc[i, j], ha="center", va="center", color="w")

# color bar
cbar = ax.figure.colorbar(im, ax=ax)
cbar.ax.set_ylabel('Pearson 相关性', rotation=-90, va="bottom")  # color bar 标题

fig.tight_layout()
plt.show()
1
2
3
4
5
6
7
8
9
10
11
12
13
14
15
16
17推荐 seaborn 的用法,更加简洁
import seaborn as sns

fig, ax = plt.subplots()
sns.heatmap(data=df, annot=True)
plt.setp(ax.get_xticklabels(), rotation=30, ha="right", rotation_mode="anchor")
plt.show()
1
2
3
4
5
6
# 3. 图片设置
# 3.1. 坐标轴
坐标轴反向
ax.invert_xaxis() # x 坐标轴反向1设置坐标值
# 按照需求设置坐标,坐标一定要有对应的数据
x_axis = ['2018-09-01', '2018-10-01', '2018-11-01', '2018-12-01', '2018-12-31']
plt.xticks(x_axis, rotation=15)  # 刻度倾斜

# 还可以对坐标重命名
x_axis = ['2022-07-25 00:00:00', '2022-07-25 04:00:00', '2022-07-25 08:00:00', '2022-07-25 12:00:00',
          '2022-07-25 16:00:00', '2022-07-25 20:00:00', '2022-07-26 00:00:00']
plt.plot(df['tm'], final)
plt.xticks(x_axis, (0, 4, 8, 12, 16, 20, 24))   # 将横坐标值重命名为小时时间
plt.show()
# 如果是多图的话需要用 set_sticks, 参考本章 2.3 多图设置

# 按照等间隔数值设置坐标
plt.xticks(np.arange(0, 25, 4))  # 范围 0-25,分度值 4

# 不显示坐标
plt.xticks([])  # 不显示 x 轴坐标
plt.yticks([])  # 不显示 y 轴坐标
1
2
3
4
5
6
7
8
9
10
11
12
13
14
15
16
17
18调整坐标轴间隔
# x 轴间隔设置为 1
x_locator = plt.MultipleLocator(1)
ax.xaxis.set_major_locator(x_locator)
1
2
3设置坐标限位
# 数值型
plt.xlim(0, 24)
plt.ylim(0, 10)

# 日期型
plt.xlim(datetime.strptime('2019-05-12', '%Y-%m-%d'), datetime.strptime('2019-05-15', '%Y-%m-%d'))
1
2
3
4
5
6设置轴标签
plt.figure()
plt.xlabel("x")
plt.ylabel("y")

# 或
fig, ax = plt.subplots()
ax.set_xlabel('x')
ax.set_ylabel('y')
1
2
3
4
5
6
7
8坐标轴字体大小
plt.figure()
plt.tick_params(labelsize=14)

# 或
fig, ax = plt.subplots()
ax.tick_params(labelsize=14)
1
2
3
4
5
6坐标轴坐标倾斜
plt.xticks(x_axis, rotation=15)  # 刻度倾斜
# 或
ax.set_xticklabels(labels=x, rotation=-45)
1
2
3坐标轴偏移
import numpy as np

# 以柱状图为例,+图像右移,-图像左移
plt.bar(np.array(x_list) +- 偏移量,y)
1
2
3
4
# 3.2. 图例 & 标题
plt.legend
# 设置图例
plt.plot(x1, y1, label='a')
plt.plot(x2, y2, label='b')
plt.legend()
1
2
3
4位置
loc=string or code位置 string 位置 code 位置 'best' 0 自适应 'upper right' 1 右上↗ 'upper left' 2 左上↖ 'lower left' 3 左下↙ 'lower right' 4 右下↘ 'right' 5 右→ 'center left' 6 左← 'center right' 7 右→(同 rigth) 'lower center' 8 下↓ 'upper center' 9 上↑ 'center' 10 中心 设置图例的显示方式
# 图例显示位置 1, 6 列
plt.legend(loc=1, ncol=6)

# 图例显示到图外:loc 此时表示定位点,bbox_to_anchor 表示定位点的位置
# 定位点为图例左上角,偏移位置 x=1.05,y=1.0
plt.legend(loc=2, bbox_to_anchor=(1.05, 1.0), borderaxespad=0.)
1
2
3
4
5
6标题
plt.title('图名', size=16)1legend 参数,更多配置参考 官方文档🔗 (opens new window)
# 3.3. 多图设置
subplot(nrows, ncols, index, **kwargs)
plt.subplot(2, 2, 1)  # 或 plt.subplot(221)
plt.plot(x1, y1)
plt.subplot(2, 2, 2)  # 或 plt.subplot(222)
plt.plot(x2, y2)
plt.subplot(2, 2, 3)  # 或 plt.subplot(223)
plt.plot(x3, y3)
plt.subplot(2, 2, 4)  # 或 plt.subplot(224)
plt.plot(x4, y4)

# 如果还需要设置副坐标轴
ax1 = plt.subplot(221)
ax1.plot(x1, y1)    # 图 1 主坐标
ax1b = ax1.twinx()
ax1b.plot(x2, y2)   # 图 1 副坐标

ax2 = plt.subplot(222)
ax2.plot(x3, y3)    # 图 2 主坐标
ax2b = ax2.twinx()
ax2b.plot(x4, y4)   # 图 2 副坐标
...
1
2
3
4
5
6
7
8
9
10
11
12
13
14
15
16
17
18
19
20subplots
# 1. 类似 subplot 的分图功能
# 1xn 类型
fig, ax = plt.subplots(1, 2)
ax[0].plot(x1, y1)
ax[0].set_xticks(x_axis, ('0', '12', '24'))  # 修改坐标轴显示
ax[0].set_xlabel('x')  # 设置 x 轴标签
ax[0].set_ylabel('y')  # 设置 y 轴标签

ax[1].plot(x2, y2)  # 其他设置同上

# 2x2 以上
fig, ax = plt.subplots(2, 2)
ax[0, 0].plot(x1, y1)
ax[1, 0].plot(x2, y2)
1
2
3
4
5
6
7
8
9
10
11
12
13
14
# 3.4. 多坐标轴(副坐标轴)
副坐标轴功能
import matplotlib.pyplot as plt

x1 = list('abcd')
x2 = x1
y1 = [1, 2, 3, 4]
y2 = [4, 3, 2, 1]

fig, ax1 = plt.subplots()

ax1.plot(x1, y1, label='a')
# 设置 ax2 与 ax1 公用横坐标
ax2 = ax1.twinx()
# 第二条线必须指定其他颜色,不然都会和第一条曲线显示相同颜色
ax2.plot(x2, y2, c='r', label='b')

plt.title('abc')
plt.show()
1
2
3
4
5
6
7
8
9
10
11
12
13
14
15
16
17图例融合
使用多坐标轴画图时有个问题是
不同坐标轴间的图例会覆盖,因此需要图例融合,将不同图例合并到一起import matplotlib.pyplot as plt x1 = list('abcd') x2 = x1 y1 = [1, 2, 3, 4] y2 = [4, 3, 2, 1] fig, ax1 = plt.subplots() # 设置 ax2 与 ax1 公用横坐标 l1 = ax1.plot(x1, y1, label='a') ax2 = ax1.twinx() l2 = ax2.plot(x2, y2, c='r', label='b') # 图例融合 lns = l1 + l2 labs = [ln.get_label() for ln in lns] ax1.legend(lns, labs, loc=9) plt.title('abc') plt.show()1
2
3
4
5
6
7
8
9
10
11
12
13
14
15
16
17
18
19
20
21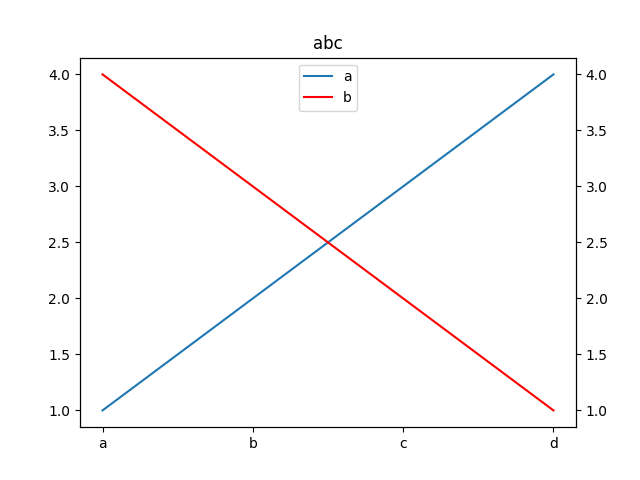
还有一种方法是不同位置分别显示
# 3.5. 辅助线
水平线
# 水平虚线,高度为 y,从 (xmin,y) 到 (xmax,y)
plt.hlines(y, xmin, xmax, linestyle=':')
1
2竖直线
# 垂直虚线,从 (x,ymin) 到 (x,ymax)
plt.vlines(x, ymin, ymax, linestyle=':')
1
2图片方格
plt.grid(True) # 开启方格1
# 3.6. 注释
plt.text() 使用
#
plt.text()
1
2plt.annotate()
# 3.7. 图片显示/输出设置
中文编码问题
plt.rcParams['font.sans-serif'] = ['SimHei']  # 解决 plt 中文乱码
plt.rcParams['axes.unicode_minus'] = False  # 用来正常显示坐标轴负号
1
2图片大小设置
plt.rcParams['figure.figsize'] = (12, 8)1图片保存
# 要放在 plt.show() 前面,不然会变成空白
plt.savefig("Picture.png")
# 批量保存图片为防止大量图片占用内存,需要关闭图片
plt.close()
1
2
3
4图片边框修改
plt.tight_layout() # 缩小边框空白1
# 4. 动态图
Animation
import matplotlib.animation as ani1
2
# 5. Pyecharts
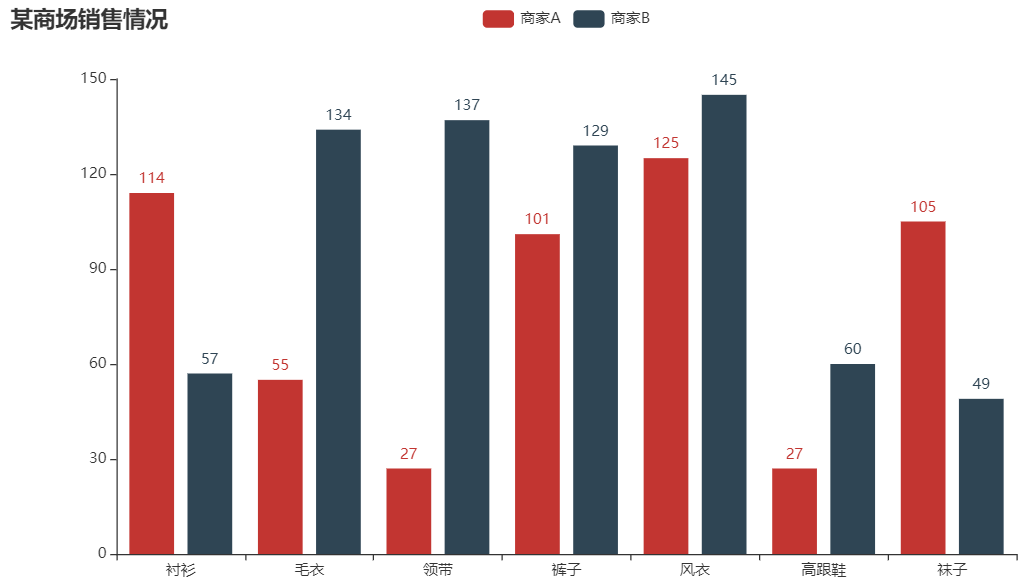
# 5.1. Bar 柱状图
from pyecharts.charts import Bar
from pyecharts import options as opts

bar = (
    Bar()
    .add_xaxis(["衬衫", "毛衣", "领带", "裤子", "风衣", "高跟鞋", "袜子"])
    .add_yaxis("商家 A", [114, 55, 27, 101, 125, 27, 105])
    .add_yaxis("商家 B", [57, 134, 137, 129, 145, 60, 49])
    .set_global_opts(title_opts=opts.TitleOpts(title="某商场销售情况"))
    .render('render.html')
)
1
2
3
4
5
6
7
8
9
10
11
2
3
4
5
6
7
8
9
10
11
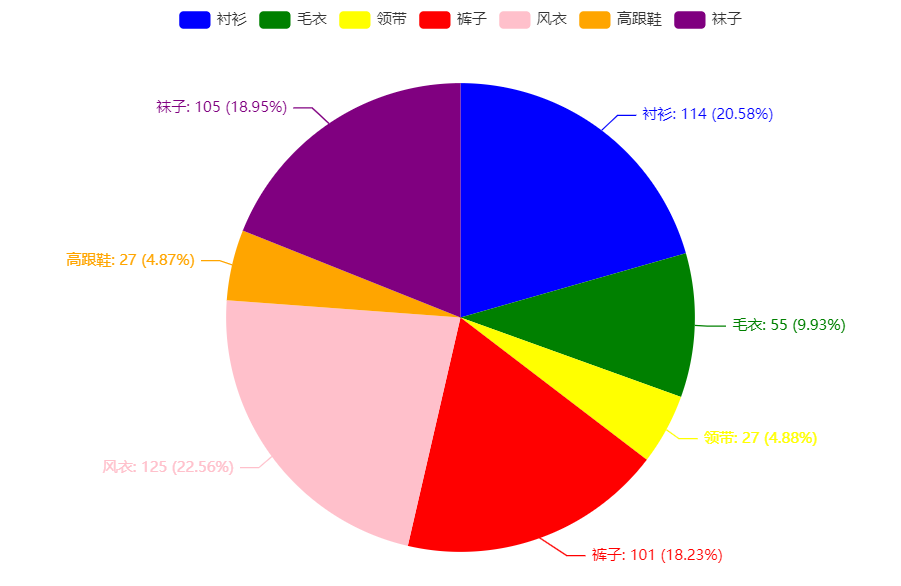
# 5.2. Pie 饼图
from pyecharts.charts import Pie
from pyecharts import options as opts

x = ["衬衫", "毛衣", "领带", "裤子", "风衣", "高跟鞋", "袜子"]
y = [114, 55, 27, 101, 125, 27, 105]
pie = (
    Pie()
    .add("", [list(x) for x in zip(x, y)])
    .set_colors(["blue", "green", "yellow", "red", "pink", "orange", "purple"])
    .set_series_opts(label_opts=opts.LabelOpts(formatter="{b}: {c} ({d}%)"))
    .render('render.html')
)
1
2
3
4
5
6
7
8
9
10
11
12
2
3
4
5
6
7
8
9
10
11
12
# 6. Pygal
# 6.1. 简介
pygal 是一款动态图表绘制库
安装
pip install pygal1
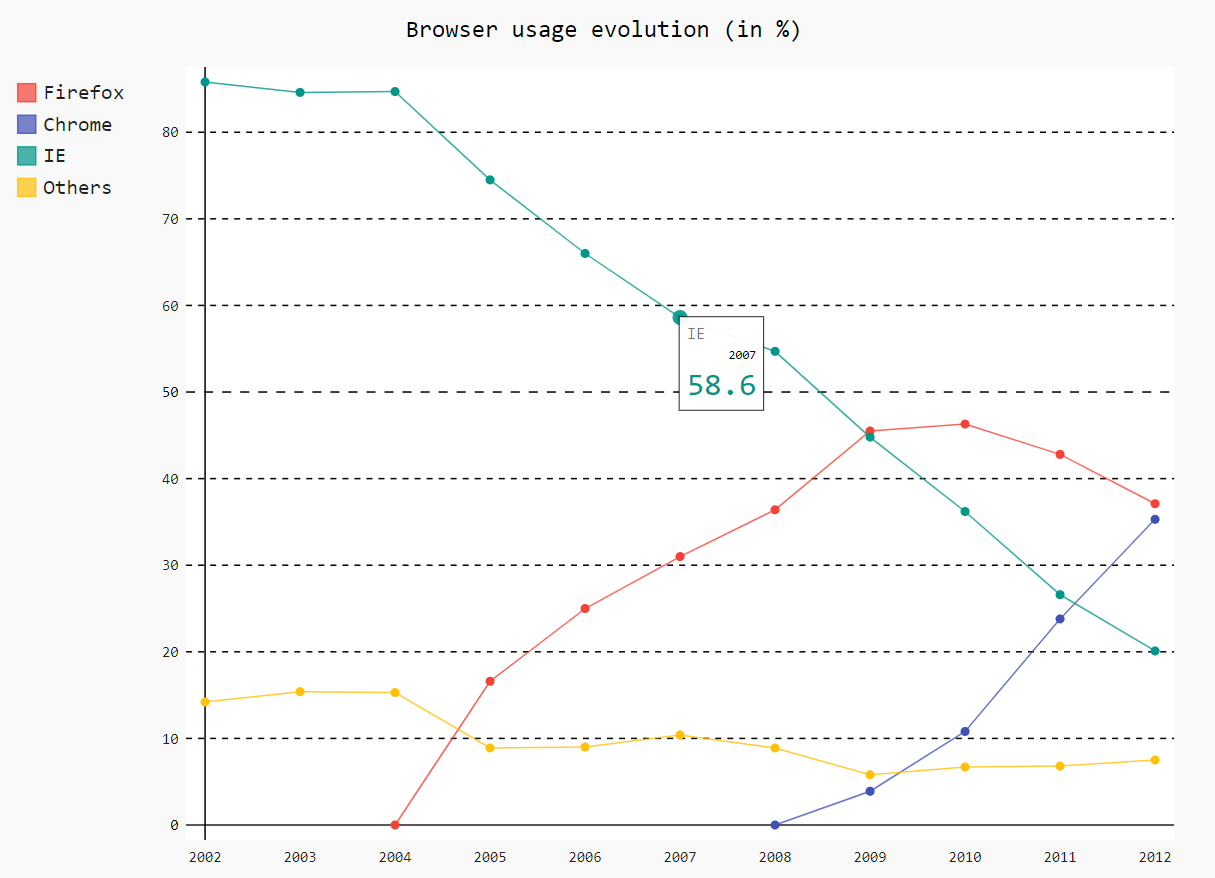
# 6.2. line
demo
# 官方示例
import pygal

line_chart = pygal.Line()
line_chart.title = 'Browser usage evolution (in %)'
line_chart.x_labels = map(str, range(2002, 2013))
line_chart.add('Firefox', [None, None, 0, 16.6, 25, 31, 36.4, 45.5, 46.3, 42.8, 37.1])
line_chart.add('Chrome', [None, None, None, None, None, None, 0, 3.9, 10.8, 23.8, 35.3])
line_chart.add('IE', [85.8, 84.6, 84.7, 74.5, 66, 58.6, 54.7, 44.8, 36.2, 26.6, 20.1])
line_chart.add('Others', [14.2, 15.4, 15.3, 8.9, 9, 10.4, 8.9, 5.8, 6.7, 6.8, 7.5])
line_chart.render_to_file('line.svg')
1
2
3
4
5
6
7
8
9
10
11结果:输出的图片用浏览器打开
